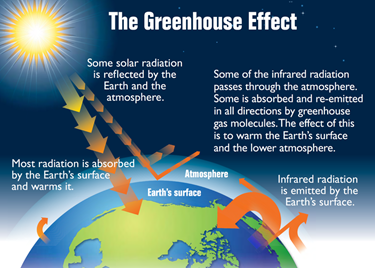
Our planet sustains life thanks to a natural balance between the energy it receives from the sun and the energy it emits back to space. This « greenhouse effect » is due to gases making up the earth’s atmosphere, which basically trap the heat and make Earth a habitable planet, with an average temperature of 15°C. The greenhouse effect process is illustrated in the figure on the side.
The vast majority of GHGs do occur naturally on Earth, but human activities have drastically increased their emissions. Since the beginning of the industrial era, humans have increased the amount of greenhouse gases in the atmosphere by about one third. This increase disrupts the thermal balance of the Earth. There is now consensus amongst scientists that it also seriously threatens life as we know it.
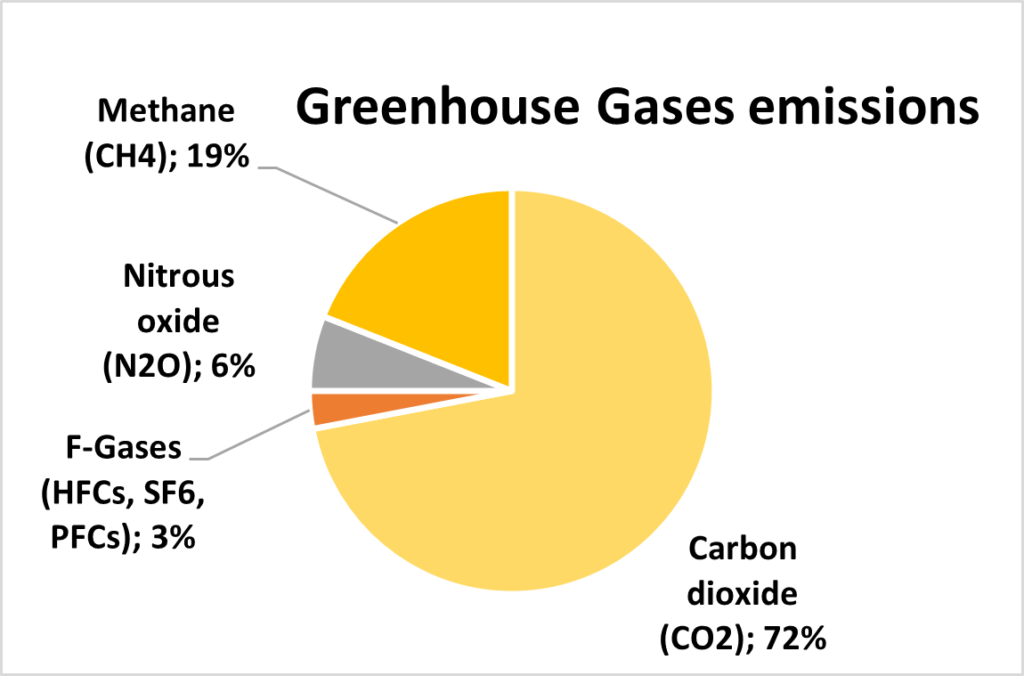
The next figure shows the approximate make-up of the six main greenhouse gases (GHG): carbon dioxide (CO2), methane, nitrous oxide and some artificial (man-made) chemicals such as fluorinated gases and other gases.
Emissions of different greenhouse gases
Carbon dioxide is more commonly referred to as “carbon” (but its emissions are still weighted as CO2, and not simple carbon).
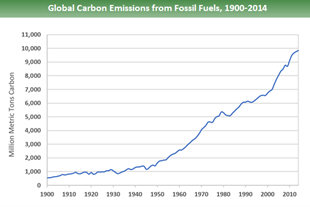
As this figure shows, the carbon emissions worldwide from fossil fuels have increased ten-fold between 1910 and 2010. What is more worrying is the shape of the curve, clearly parabolic, or even exponential.
Evolution of worldwide global carbon emissions (source : EPA)
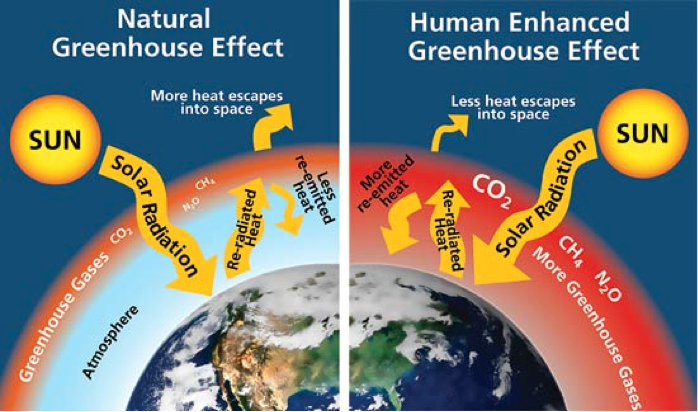
Because of the increased concentrations of greenhouse gases (“GHGs”) in the Earth’s atmosphere, the greenhouse effect is enhanced. The next figure shows a schematic of the phenomenon. This increased greenhouse effect causes global warming.
Overall, the average Earth’s surface temperature is increasing – roughly 1°C over the last century. Scientists predicts that the average temperature might rise up even more – by 1.5 to 3°C, depending on the scenario. This change in temperature seriously affect climate: shifts in precipitation, increase in the occurrence of severe weather events, polar ice melting, increase in sea water levels with its effects on soil erosion, etc. The figure below (publichealthnotes.com) shows a schematic of the enhanced greenhouse effect.
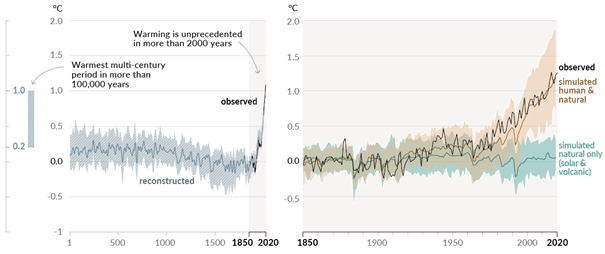
The next figure (source: 2021 IPCC report) shows the change in Earth’s surface temperature over the years. What is striking is the latest development in the last century, coinciding with the increase in GHG emissions. Again, we observe an exponential growth.
Changes in global surface temperature relative to 1850-1900 (IPCC 2021 Report)
Carbon Dioxide equivalent of GHGs
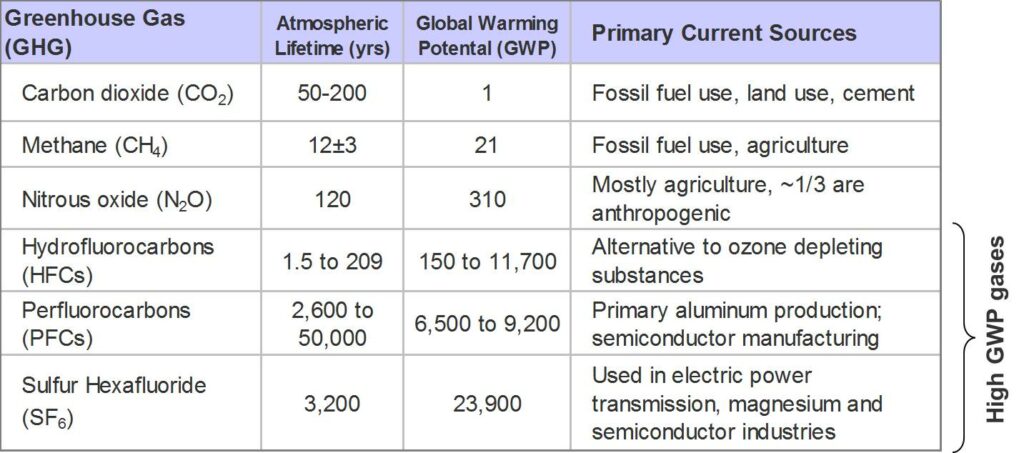
In order to compare them, greenhouse gases are assigned a Global Warming Potential (GWP) relative to carbon dioxide. This factor is based on the global warming effect of 1 kg of substance, expressed as its equivalent mass of carbon dioxide (kg CO2eq). See the table below (source: EPA).
GWP for different grehouse gases
Origins of GHGs emissions
Mankind either generates extra greenhouse gases, or prevent the environment from naturally absorbing them. The main GHGs originate from:
The combustion of fossil fuels (CO2): power generation, engine fuel (for transportation), heat generation for energy—intensive industries (cement, steel, glass…);
Deforestation: since CO2 is absorbed by plants, cutting trees down removed a “carbon sink”, hence the additional emissions;
Farming (cattle industry and cultivation of crops): livestock naturally emits methane that is generated during digestion.
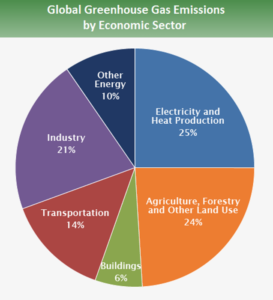
Breakdown of GHG emissions by economic sector.
Combustion and Power Generation
Fossil fuels are mostly used to generate heat and/or power. Coal, oil, LPGs, propane, butane and natural gas are examples of fossil fuels. They all contain a high proportion of carbon in their molecules.
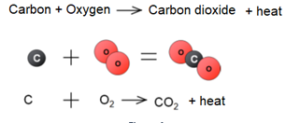
Natural gas is mostly made of methane. A molecule of methane contains one carbon atom and four hydrogen atoms. During combustion, the carbon atom combines with the oxygen from the air to:
Generate the “heat of combustion” – typically around 11 kWh for a normal cubic meter of natural gas;
Form carbon dioxide from the carbon and oxygen molecules
Form water from the hydrogen and oxygen molecules
Methane molecule
Carbon combustion generates CO2
Carbon emissions from heat/power generation
Carbon dioxide is emitted during the combustion of fossil fuels, but the combustion step is not the only process to take into account when overall emissions are to be estimated. A more rigorous method should include all the steps and processes to generate a given amount of heat/power. A non-exhaustive list of processes for any fuel includes all phases such as production, treatment, transmission, distribution, combustion and all other phases (construction of the plants, the compression stations, the transmission means, the transportation of the personnel, plant maintenance, end-of-life disposal, etc.…). A “Life Cycle Analysis” (LCA) therefore takes into account all emissions associated with the life of a given service or product. This approach is also called “cradle-to-grave” analysis.
This holistic approach is rarely adopted for fossil fuel combustion systems. Instead, the carbon dioxide released during combustion is used in most cases to estimate carbon emissions.
For 1 MWh of heat, the “carbon” emissions from the combustion of fossil fuels are approximately taken as:
Around 200 kg of CO2 from natural gas
Around 400 kg of CO2 from coal (because it contains much more carbon than methane)
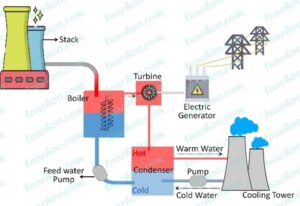
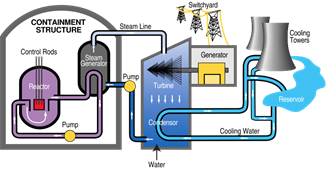
Generating 1 MWh of electricity from heat usually requires 2 to 2.5 MWh of heat. Thus, the carbon emissions amount will depend on the nature of the heat generation process. The emissions from using coal will be more important than when using natural gas. And using a nuclear reactor to produce heat will generate even less carbon emissions.
Thermal power plant (source: teachoo.com)
Nuclear power plant (source: Wikimedia)
The next table shows approximate carbon emissions factors when using different sources of energy. It should be noted that the emissions factors depend strongly on the location. These numbers should not be used without checking the local factors.
Energy
kg CO2 per MWh (approximate)
Heat from natural gas
200
Heat from coal
400
renewable electricity
nearly zero
Electricity from nuclear plant
70
Electricity from nuclear plant - natural gas
500
Electricity from nuclear plant - coal
1000
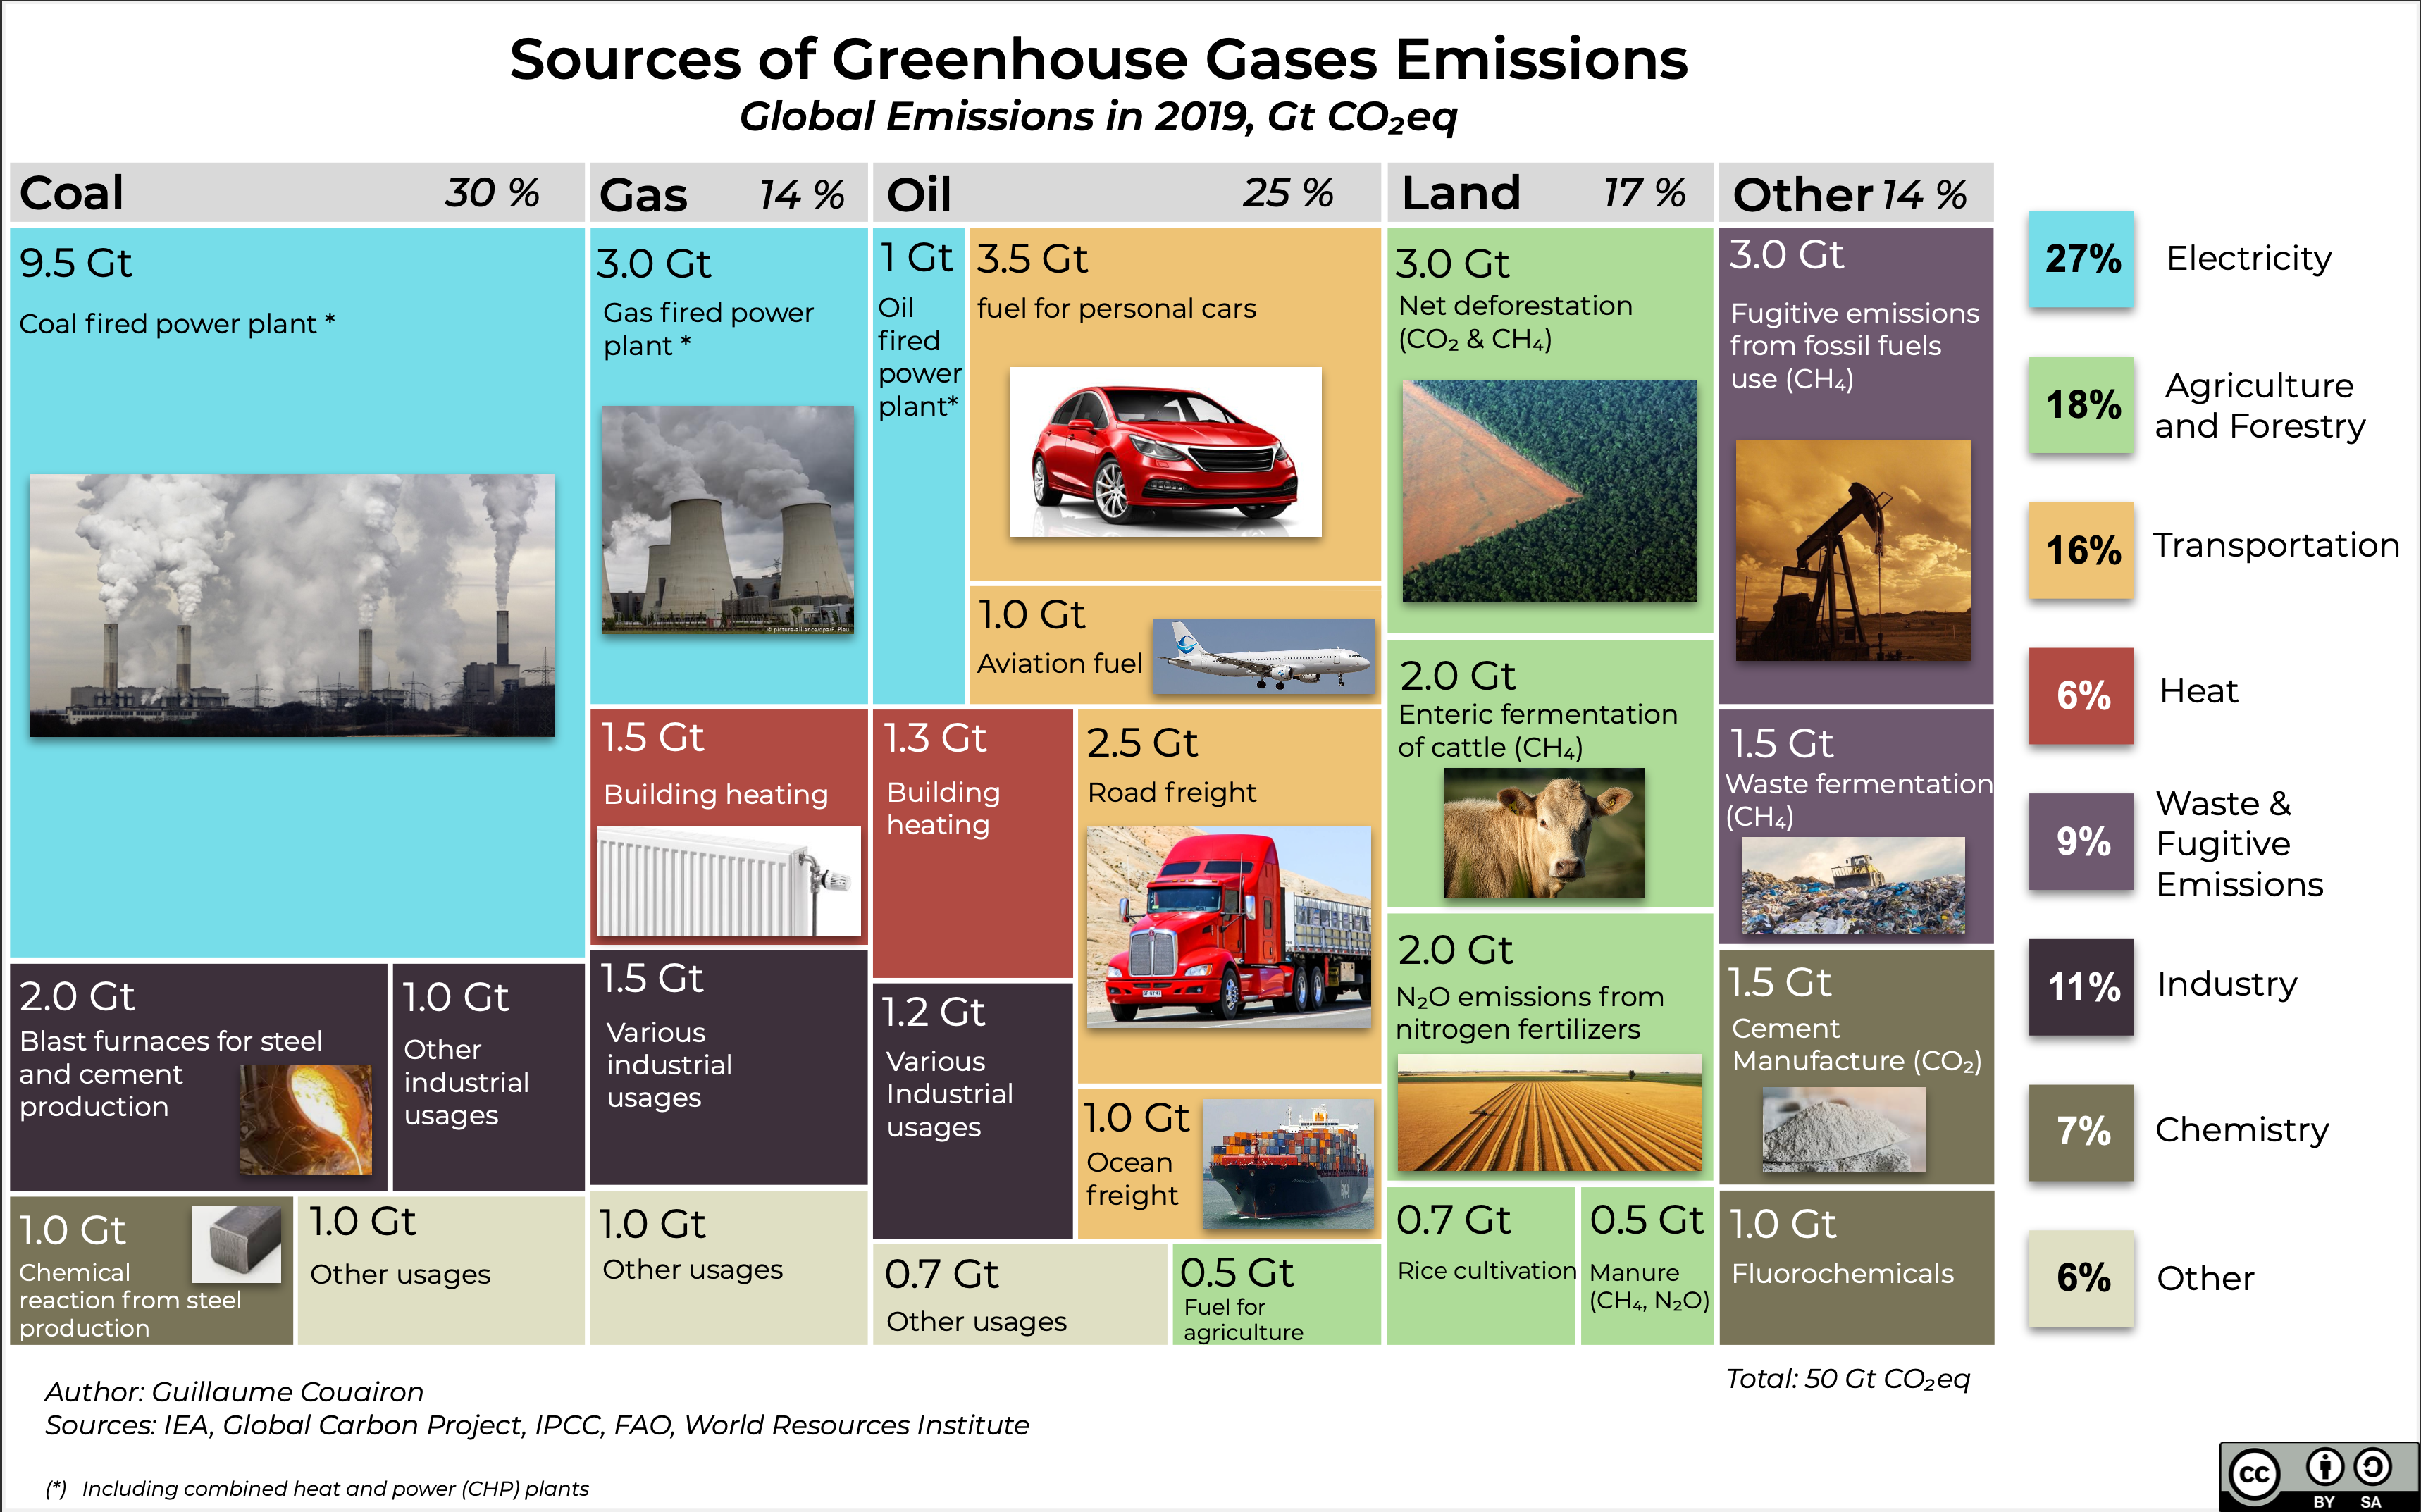
GHGs Global Emissions - breakdown
The following breakdown for carbon emissions was prepared by Guillaume Couairon.